Joseph is a Project Manager whose responsibility includes managing a project from its inception to completion. He must define objectives that can be achieved and must ensure planning and execution of the project. He must also work with the Resource Manager to ensure that competent and sufficient resources are available to execute the project.
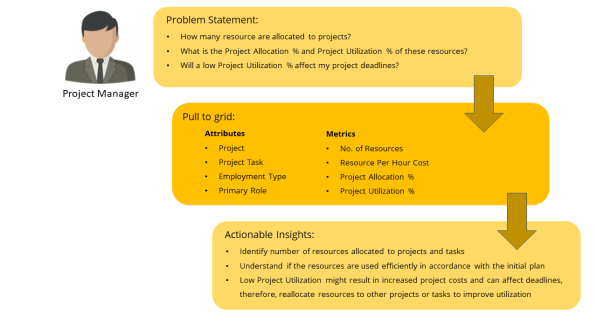
As a Project Manager, Joseph wants to analyze the number of resources allocated to projects and understand if these resources are utilized efficiently. For example, a contract resource might be completely allocated to a specific project, however, the actual hours spent by this resource on the project might be less compared to the initial planned effort. This reduction in project utilization can affect the project deadlines and also increase the overall project cost.
Let us create a simple grid report to help Joseph analyze the project utilization of resources.
To create this report, log in to Digital.ai Intelligence Applications and perform the following steps:
 icon from the toolbar and click Existing Dataset....
The ITPA_Project Resource Task iCube is added and can be accessed from the DATASETS panel.
Tip: The link symbol next to some attributes indicate that the attribute is common across the datasets.

Tip: To rename the visualization title, click the  icon in the visualization title bar and then click Rename.
The report related to project allocation and utilization of resources based on their employment type and role is displayed with the corresponding values.
Here is an example of the report displayed as a grid.
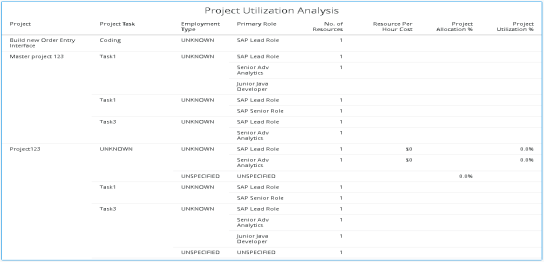
Using this report, Joseph can understand whether the resources allocated to project tasks are utilized efficiently and in accordance with the initial plan. If any of the resources are under utilized for the projects, Joseph can investigate and understand the reason for under utilization, and can undertake measures to ensure that the resources are used efficiently.
For example, from the report, the Functional and Technical Design task of the Automated Security Enhancements project has been allocated 6 employees and 2 contractors. The Project Allocation for all these resources is 100%, however, the Project Utilization % of the Data Base Analyst employee and the Business Analyst contractor is just 30%.
Joseph realizes that these resources are paid an hourly rate of $27 and $14 respectively and with the resources being under utilized, it might increase the overall project cost and can also affect the project deadlines.
Joseph can mitigate these risks by reallocating these resources to other projects or tasks thereby improving their Project Utilization %.
Related Topics
Analyzing capacity utilization based on resource skills
© 2022 Digital.ai Inc. All rights reserved.