Open topic with navigation
Analyzing Work Item State Changes
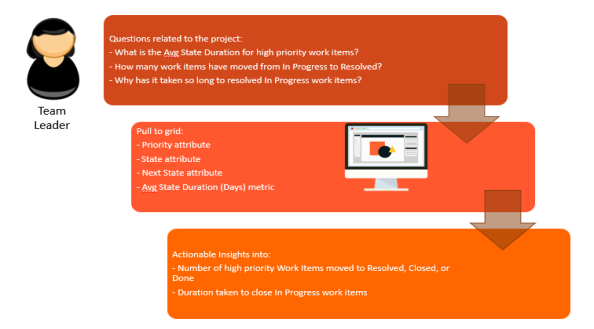
Julie is a Team Leader who is managing multiple teams working on multiple projects. As a Team Leader, she wants to analyze the time taken by major or critical priority work items to move from ‘In Progress’ state to ‘Resolved’, 'Closed', or 'Done' states. She wants to understand the time lapse between the previous and next states because it is critical for high priority work items to be resolved at the earliest. Analyzing the state changes can help her to:
- Identify work items that remained in a particular state for long duration
- Identify blockers, if any, for unresolved work items and work towards mitigating such issues
- Identify lapses and recurring quality issues for unresolved work items
Generating the report
To analyze state duration for high priority work items, Julie has to login to Digital.ai Intelligence Applications and perform the following tasks in the Work Item State Change iCube of Create Lens:
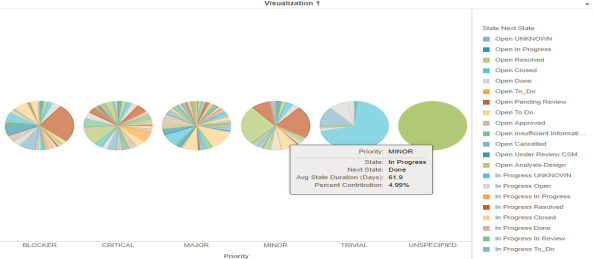
- From the GALLERY panel, select the desired visualization type here.
In this example, Pie Chart has been used.
- From the DATASETS panel:
- Drag the State and Next State attributes into the Color By and Slice fields of the EDITOR.
- Drag the Priority attribute into the Rows field.
- Drag the Avg State Duration (Days) metric into the Angle filed.
- Drag the Row Count metric into the Tooltip field.
- In the Filters panel, select the appropriate filters to display the required data:
- Select the In Progress check box for the Previous State attribute.
- Select the Resolved, Closed, and Done check boxes for the Next State attribute.
- Select the Critical and Major check boxes for the Priority attribute.
Here is an example of the State Duration analysis displayed as a Pie Chart.
Analyzing the report
Using the report, the team leader can do the following:
- Find out how long a Work Item has taken to move from In Progress to Resolved, Closed, or Done.
- Investigate reasons for a Work Item to remain unresolved for a long period.
- Re-prioritize the work load of team members to address Critical or Major priority items.
© 2022 Digital.ai Inc. All rights reserved.