Let us look at a simple scenario to understand how you can use the Work Item Burn Down iCube to analyze your sprint progress.
Jim is a Scrum Master who oversees how work items are being handled in every sprint. He may have multiple teams working on multiple projects to monitor.
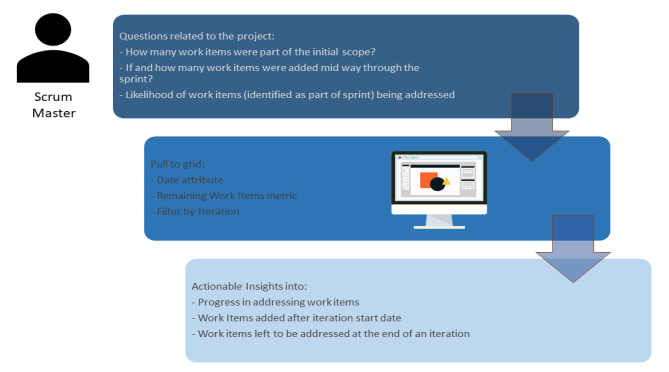
As a Scrum Master, he wants to understand how teams are progressing in any given sprint. It is critical for him to know how many items were part of the initial scope, if and how many work items were added half-way through the sprint, if the teams are making expected progress in addressing the work items, and so on. Using this data, he charts a burn down graph at the end of every sprint which will help him analyze important project data such as:
To analyze the sprint burn down, Jim has to login to Digital.ai Intelligence Applications and perform the following tasks in the Work Item Burn Down iCube of Create Lens:
Here's an example sprint burn down displayed graphically:
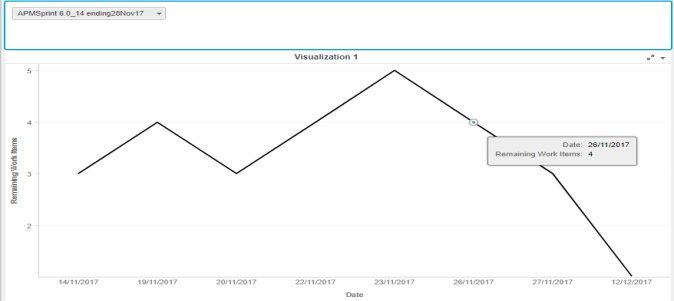
Using the report, the Scrum Master can do the following:
Related Topics
© 2022 Digital.ai Inc. All rights reserved.