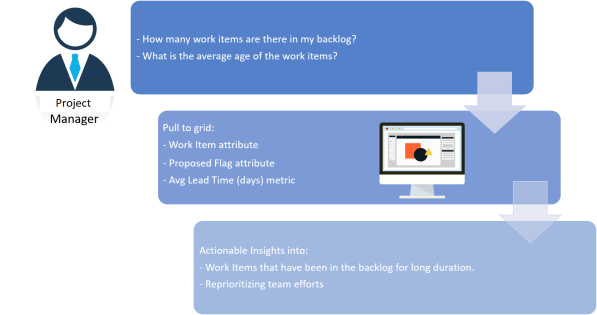
Let us look at a simple scenario to understand how you can use the Work Item iCube to analyze your project backlog.
Andrew is a Project Manager who's managing multiple teams working on multiple projects.
As a Project Manager, he wants to understand how many work items are in the project backlog, and for how long. Identifying work items which have been in the backlog for a long duration not only helps him in bringing the reason for the delay to the fore, but also helps him in planning and placing his resources better. Analyzing the backlog enables him to:

To analyze the project backlog, Andrew has to login to N360™ and perform the following tasks in the Work Item iCube of Create Lens:
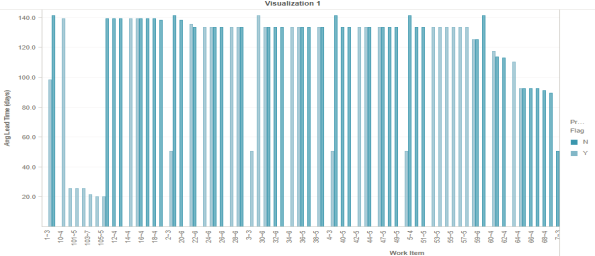
Here's an example backlog analysis displayed graphically:

Using the report, the Project Manager can do the following:
Related Topics
© 2022 Digital.ai Inc. All rights reserved.