Let us look at a simple scenario to understand how you can use the CI Build iCube to analyze if the development teams are checking in their code frequently.
John is a Development Manager who is managing multiple teams working on multiple projects.
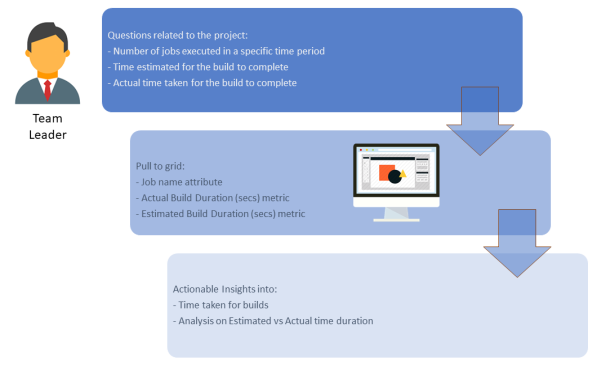
As a Development Manager, he wants to analyze how frequently are jobs being executed. In a continuous integration environment, the development teams are expected to submit their code changes frequently, as every check in triggers a job run. Analyzing the frequency helps him to identify outliers and reason out:
To analyze the frequency of jobs being executed, John must login to Digital.ai Intelligence Applications and perform the following tasks in the CI Build page:
From the DATASETS panel,
Here is an example time duration analysis displayed as a bar chart:
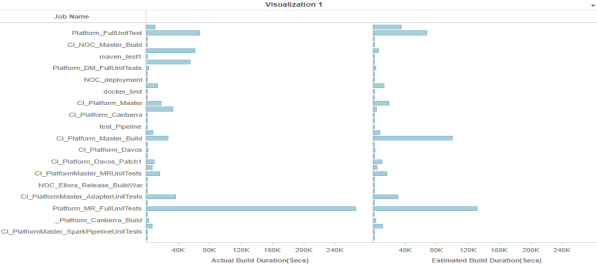
Using the report, John can:
Related Topics
© 2022 Digital.ai Inc. All rights reserved.