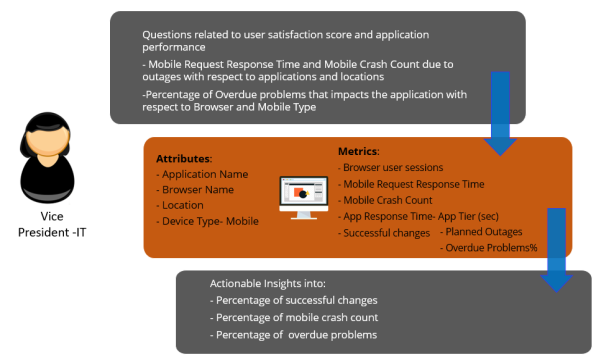
Janet is a Vice President of IT operations. She wants to understand the overall health of applications across various performance vectors, such as incident and problem volumes, change success rates, outage, and downtime durations, failed and stalled transactions, and user performance of key transactions, as it gives a composite picture of application operational health.
Janet also wants to know if there are specific carrier or location issues that may affect certain geographies. She may even want to track all applications to see problem spots and systemic issues that has business impact. So, she logs in periodically (weekly or monthly) to get consolidated views of overall applications' performance and their impact on Lines of Business and associated revenues.
The main goal of Janet is to indicate if IT operations are on track to fulfill the needs of businesses while IT operational processes and teams are working at optimal productivity and cost.
Following are some examples of areas that contribute to an understanding of overall application health:
To analyze the overall health of applications due to outages and problem with respect to end user performance across geographies, perform the following procedures:
Prerequisite: Ensure that you have logged into Digital.ai Intelligence Applications using appropriate credentials.
In this example, a bar chart is used. For more information on dossiers, refer Dossiers
From the top navigation panel, click  and select Existing Dataset.
In this example, Change, Outage, Problem, Summary, and Mobile Application Summary iCubes are selected. The selected dataset is added to the DATASETS panel.
For more information on Monitor attributes and metrics, refer the Digital.ai Intelligence Applications User Documentation.
Drag the Location attribute and drop it into the Break By and Color By sections.
In the Break By section, select the Stacked option to change the way location is represented by application and browser operating system.
Using the report, Janet can understand the overall impact on application's health during an outage or known problem, or implementation of a change.
© 2022 Digital.ai Inc. All rights reserved.