The Release Phase Overview dashboard provides insights into the various phases of Releases, helps you understand the status of individual phase level tasks, which in turn provides an overall indication of how your Release is progressing. With these insights, you can identify phases or tasks that can potentially impact the Release schedule and take suitable measures to mitigate the issues.
Release Phases are logical stages in a Release process that focus on specific release activities, such as Development, Testing, Deployment, and so on.
As a Release Owner, you can use this dashboard to understand the following business scenarios:
You can use the filter in the dashboard to analyze information related to specific Release Owners, Release Tag, Release Status, and Releases.
Note: The dashboard does not display information related to all available Releases. Ensure that you select a specific Release from the filter to view the dashboard.
The Release Phase Overview dashboard displays information pertaining to the last 30 days and consists of the following sections:
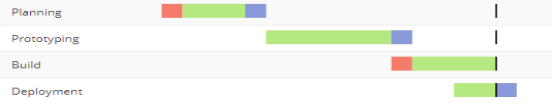
Displays a grid with details about the schedule of various Release Phases. The grid includes the Planned Start Date of every phase and displays a Gantt chart that illustrates each phase schedule. The bar graph is color-coded, and each section of the graph denotes the duration with respect to delay in start, actual duration, and schedule variance. The starting point of the graph indicates the planned start date of the release and the solid line indicates the planned end date.
You can click a particular Phase from this grid to drill down and view detailed information about the selected Phase in the subsequent sections.
This section lists the following key measures related to the status of Release Tasks:
Displays a grid that provides detailed information about the Release tasks categorized based on the Task Type. Task Type denotes tasks that require user actions, tasks that are automated, and tasks that serve as containers to group other types of tasks.
The grid displays details, such as Task Name, Resource assigned to the task, Planned and Actual Start Date, Planned and Actual End Date, Planned and Actual Duration, Schedule Variance, and duration for which the task has been overdue.
This section lists all the attributes and metrics that have been used to build the reports in this dashboard.
| Attribute Name | Description |
|---|---|
| Owner | Name of the person who is in charge of the Release. |
| Release Tag | Labels or keywords associated with a Release to classify Releases based on certain characteristics. |
| Release Status | Current status of the release, such as In Progress, Paused, Aborted, Completed, and so on. |
| Release | Name of the Release. |
| Longest Task |
Displays the name of the Release task that contains the longest actual duration. |
| Phase with Highest Manual Task % | Displays the name of the Release Phase that contains the highest percentage of tasks that require user action. |
| Planned Start Date | Displays the date on which the Release Phase is supposed to start. |
| Task Type (Standardized) | Displays the Digital.ai standardized task type categories denoting tasks that require user actions (Manual), tasks that are automated (Automated), and tasks that serve as containers to group other types of tasks (Group). |
| Task Name | Displays the name of the Release Task. |
| Resource | Displays the name of the person assigned to the Release Task |
| Planned Start Date | Displays the date on which the Release Task is supposed to start. |
| Planned End Date | Displays the date on which the Release Task is supposed to start. |
| Actual Start Date | Displays the date on which work started on the Release Task. |
| Actual End Date | Displays the date when the Release Task completed. |
| Metric Name | Description | Metric Formula |
|---|---|---|
| Tasks Skipped |
Displays the total number of completed Release tasks whose status is Skipped. | Count([No of Completed Release Tasks])<[Release Task Status = SKIPPED]> |
| Schedule Variance | Displays the total percentage of difference in schedule between the planned duration and actual duration of the Release. | IF((([Release Planned Duration] = 0) And ([Release Actual Duration] > 0)),1,(([Release Actual Duration] - [Release Planned Duration]) / [Release Planned Duration]))) |
| Start Delay Duration (Days) | Displays the average number of days lost in starting the release with respect to the scheduled start date of the release. | [Release Start Delay Duration] / (86400 * [Release Volume]) |
| Overdue Tasks | Displays the total percentage of tasks that are past their planned end date. | [No of Overdue Release Tasks] / [No of Release Tasks] |
| Phase Duration | Internal Scalable Vector Graphic (SVG) metric used to represent the Release Phase duration, such as start delay duration, actual duration, and schedule variance. | - |
| % Failed Tasks | Percentage of tasks whose status is Failed. | [No of Failed Release Tasks] / [No of Release Tasks] |
| % Flagged Tasks | Percentage of tasks whose Release Task Flag status is either in At Risk or Attention Needed. | [No of Flagged Release Tasks] / [No of Release Tasks] |
| % In progress Tasks | Percentage of tasks that have started and are currently in progress, and don't yet have an actual end date. | [No of Inprogress Release Tasks] / [No of Release Tasks] |
| % Overdue Tasks | Percentage of tasks that are past their planned end date. | [No of Overdue Release Tasks] / [No of Release Tasks] |
| % Pending Tasks | Percentage of tasks that are planned and whose status is not in Completed, Aborted, or Skipped. | [No of Pending Release Tasks] / [No of Release Tasks] |
| Planned Duration (Days) | Average duration across all tasks where duration is the time difference between the planned start date and planned end date of the task. | [Release Task Planned Duration] / (86400 * [No of Release Tasks]) |
| Actual Duration (Days) | Average duration across all tasks where duration is the time difference between the actual start date and actual end date of the task. | [Release Task Actual Duration] / (86400 * [No of Release Tasks]) |
| Schedule Variance % | Displays the percentage of difference in schedule between the planned duration and actual duration of the Release Task as compared to the planned duration. | (IF((([Release Task Planned Duration] = 0) And ([Release Task Actual Duration] > 0)),1,(([Release Task Actual Duration] - [Release Task Planned Duration]) / [Release Task Planned Duration]))) |
| Overtime Duration (Days) | Average number of days for which Release Tasks have been past their planned end date. | [Release Task Overtime Duration (Days)] / [No of Release Tasks] |
© 2022 Digital.ai Inc. All rights reserved.